Create Standalone Charts
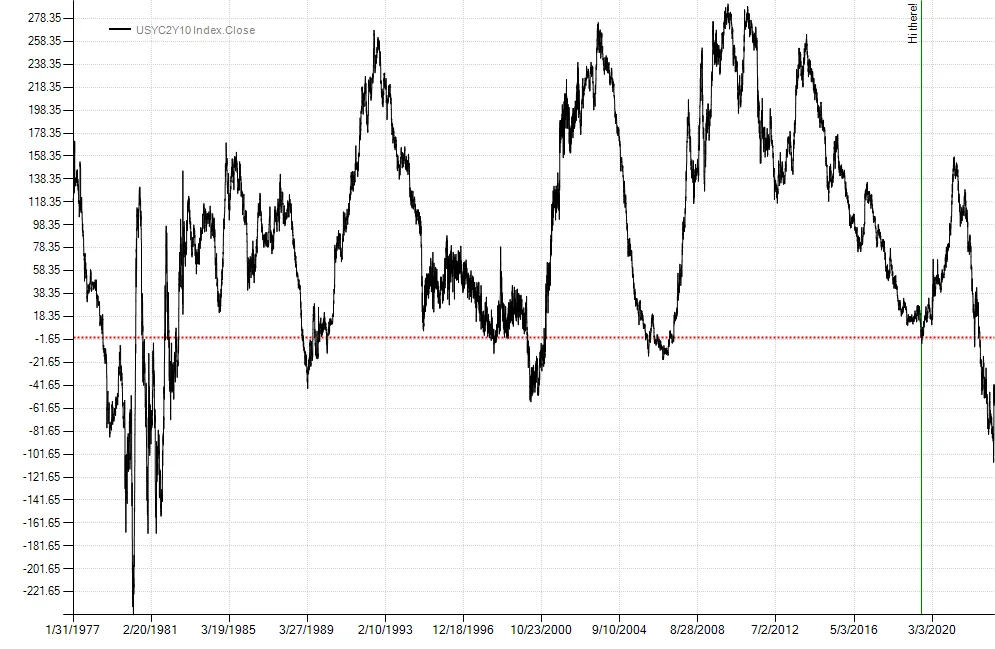
Sometimes it’s helpful to create charts independently of a strategy. This can be done by passing plot instructions to the Chart class found in the Balsam.Charting namespace. In the example below, we plot the 2-10 yield curve with a horizontal line on the y-axis and a vertical line on the x-axis. Finally, we save the chart to a file before calling the ShowDialog() method on ChartForm. ChartForm is a Windows Form specifically designed for displaying charts. If you are building GUI’s in Windows, Chart may be used as a WinForms component and can also be used by WPF apps with theWindowsFormsHost control.
var twoTen = BarSeries.Load(@"c:\data\temp\USYC2Y10 Index.csv").Close;var cht = new Chart();cht.Plot(new PlotInstruction { Series = twoTen }, new PlotInstruction { YValue = 0, Color = Color.Red, LineStyle = "Dot", Width = 2 }, new PlotInstruction { XValue = new DateTime(2019, 8, 27), Color = Color.Green, Text = "Hi there!" });cht.SaveImage(@"c:\temp\myChart.png", ChartImageFormat.Png);new ChartForm(cht).ShowDialog();