Backtest Reports
Backtest reports are generated using customizable Excel templates. The default money management template ‘MoneyManagementTemplate’ has the following tabs:
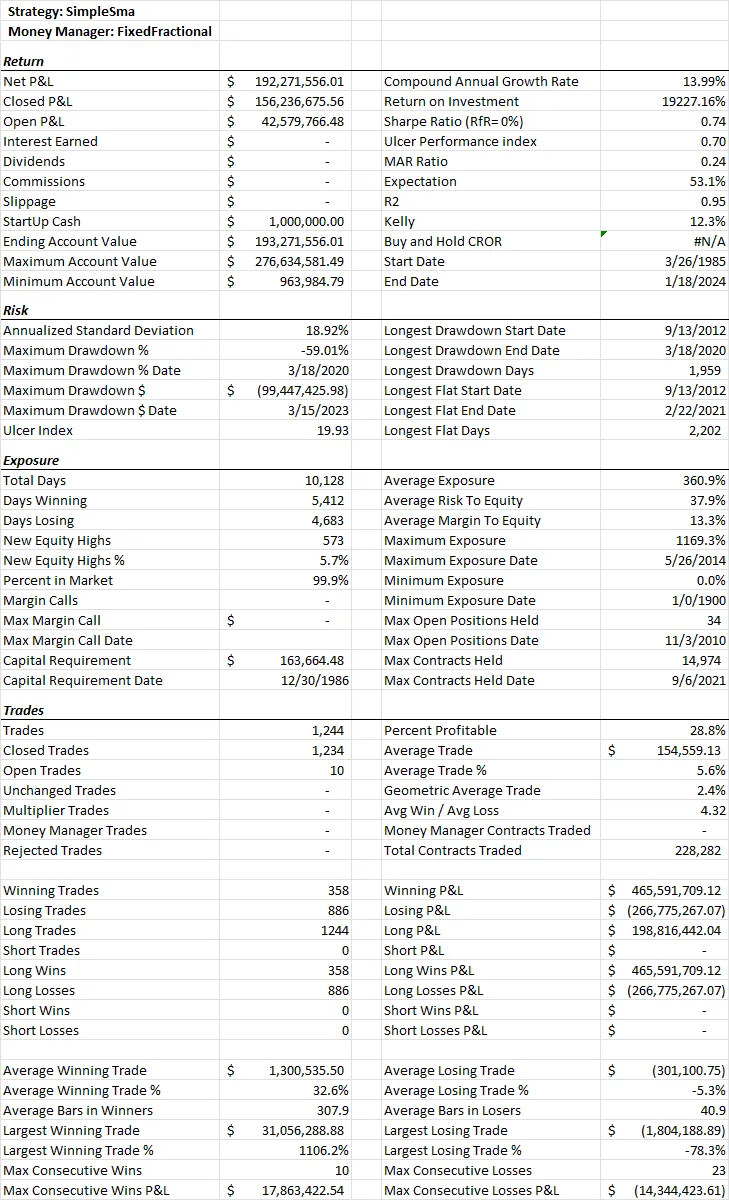
Performance Stats
Section titled “Performance Stats”‘Performance Stats’ is the first worksheet of the backtest report and contains key portfolio metrics and trade statistics.
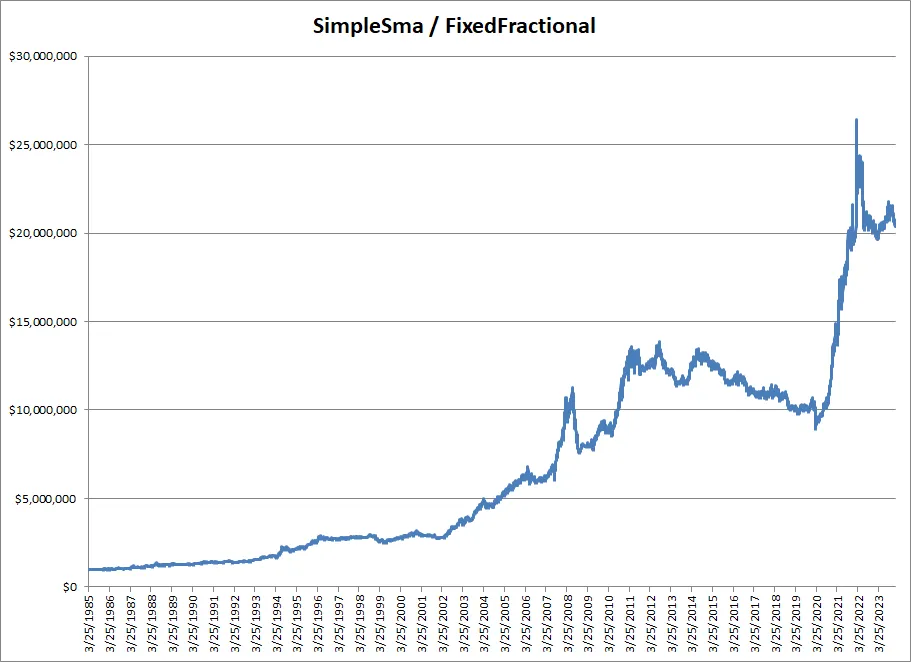
Equity Curve
Section titled “Equity Curve”The next page contains a chart of the end-of-day account balance, commonly called an equity curve.
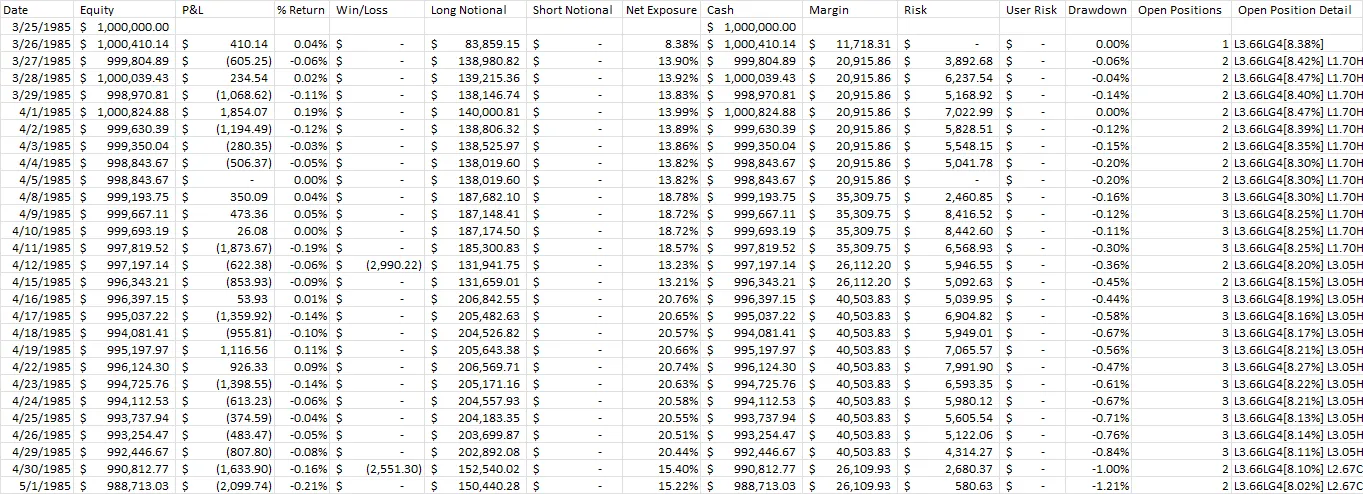
Equity Detail
Section titled “Equity Detail”The Equity Detail tab contains daily equity, return, exposure, margin, and open position information.
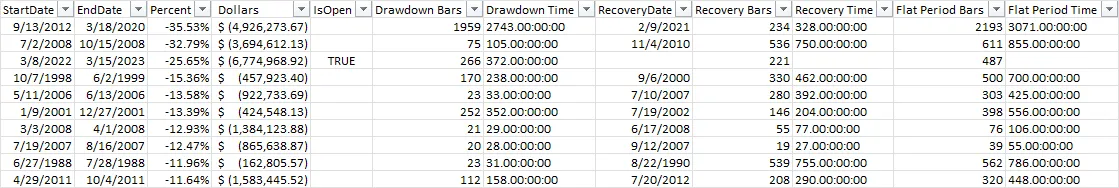
Drawdowns
Section titled “Drawdowns”The Drawdowns tab contains detailed information on all drawdowns in the equity curve sorted by the worst percentage drawdown.
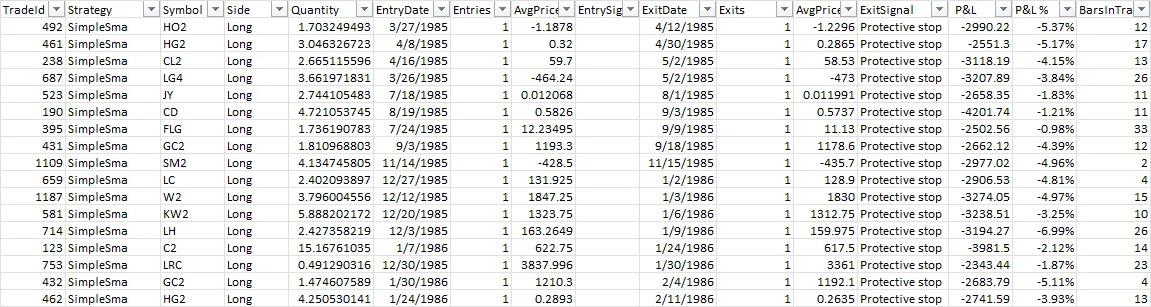
Trade Detail
Section titled “Trade Detail”The Trade Detail tab contains detailed information on individual trades.
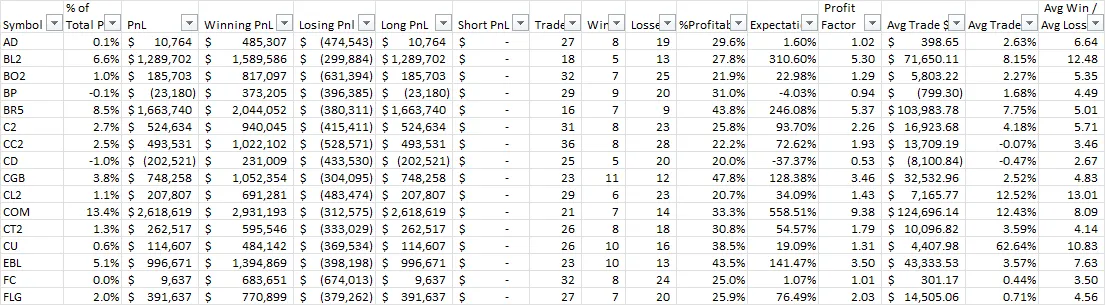
Symbols
Section titled “Symbols”The Symbols tab shows performance statistics aggregated by symbol. Group, Sector, and Instrument performance summaries can also be enabled by setting the appropriate property in MoneyManager.Options before running the simulation, assuming that information is available in your instruments file.
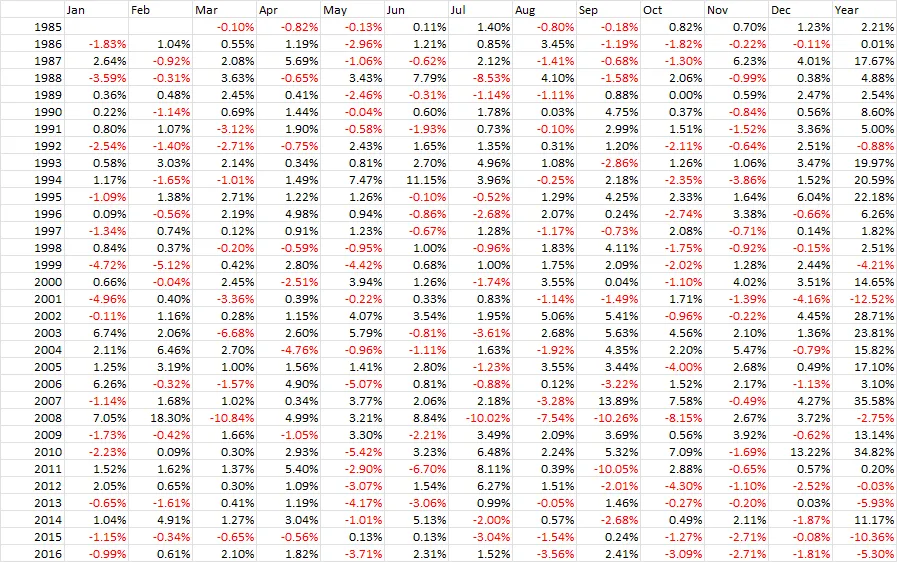
Performance grid
Section titled “Performance grid”Next we have a standard performance grid allowing you to see monthly and annual performance at a glance.
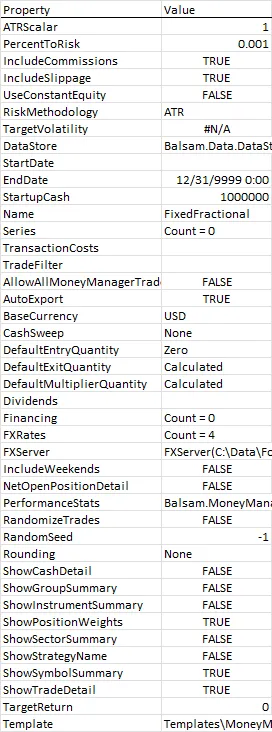
Settings
Section titled “Settings”Finally, the Settings tab contains various settings used by the money manager that generated the report.
Alternative templates
Section titled “Alternative templates”When running many tests you may prefer to work with a streamlined template displaying a few key stats in a single column. This makes it easier to copy and paste results within Excel for side-by-side comparisons. As an example, try setting the money manager Template property to use the built-in ‘ComparisonTemplate’ as shown below:
var strat = new SimpleSma();strat.MoneyManager = new FixedFractional() { PercentToRisk = 0.001 };strat.MoneyManager.Options.Template = "ComparisonTemplate";strat.RunSimulation(data);See Customizing backtest reports for more information on customizing templates.