Recipes
The following code snippets demonstrate certain common tasks. There is often more than one way to accomplish the same thing, so several variants may be shown. Many blog posts on this site include the actual code used to generate the charts and studies. Watch this page for more ‘recipes’ to be added in the future.
Loading data
Section titled “Loading data”using Balsam; //primary namespaceusing Balsam.DataServers; //namespace containing data servers
//create a new CsiBarServer, a specialized AsciiBarServer for reading backadjusted continuous futures datavar server = new CsiBarServer(@"c:\data\csi\current");//get available symbolsIEnumerable<string> symbols = csi.GetSymbols();Console.WriteLine(string.Join(" ", symbols));//load the entire history for the S&P 500 e-MiniBarSeries series = server.LoadSymbol("ES");//load gold history starting in 2020series = server.LoadSymbol("GC", new DateTime(2020, 1, 1));//load 30Yr US Treasury Bond for all of 1987series = server.LoadSymbol("US", new DateTime(1987, 1, 1), new DateTime(1987, 12, 31));//load entire history for S&P, gold and 30 YrBarSeriesCollection data = server.LoadSymbols("ES", "GC", "US");//load history for S&P, gold and 30 Yr starting in 2020data = server.LoadSymbols(new DateTime(2020, 1, 1), "ES", "GC", "US");//load entire history for all available symbolsdata = server.LoadAll();
//load a TimeSeries directly from a fileTimeSeries bulls = TimeSeries.Load(@"c:\data\mktdata\AAIIBull.csv");
//create a new AsciiBarServer for data in the format of Date,Closevar svr = new AsciiBarServer(@"c:\data\mktdata", AsciiBarServer.DC);//or pass the fields as a params array of stringssvr = new AsciiBarServer(@"c:\data\mktdata", "Date", "Close")//or let the data server infer the format automatically assuming it is one of several common formatssvr = new AsciiBarServer(@"c:\data\mktdata");
var bulls = svr.LoadSymbol("AAIIBull").Close; //return just the TimeSeries of closing pricesVariable dictionaries
Section titled “Variable dictionaries”VariableDictionary is an object dictionary with a key of type string used to pass information to strategies and money managers. It is most often used to set properties on a Strategy when running multi-threaded simulations.
VariableDictionary vd = new VariableDictionary();vd["Length"] = 10;vd["StopCoefficient"] = 2.5;vd["TransactionCosts"] = new TickTransactionCosts { Commission = 0.01, Ticks = 1};Running strategies
Section titled “Running strategies”using Balsam;using Balsam.DataServers;using Balsam.MoneyManagement;
var server = new CsiBarServer(@"c:\data\csi\current");var data = server.LoadAll();
var strat = new Balsam.Benchmarks.SmaCrossover();strat.RunSimulation(data);
strat = new Balsam.Benchmarks.SmaCrossover() { ShortLength = 20, LongLength = 120 };strat.PrimarySeries = data[0];strat.RunSimulation();
VariableDictionary vd = new VariableDictionary();vd["ShortLength"] = 20;vd["LongLength"] = 120;
strat = new Balsam.Benchmarks.SmaCrossover();strat.SetProperties(vd);strat.RunSimulation();
strat = new Balsam.Benchmarks.SmaCrossover();strat.SetProperties(vd);strat.MoneyManager = new FixedFractional() { PercentToRisk = 0.0020 };strat.RunSimulation();
//mulit-threaded simulationvar moneyManager = new FixedFractional();moneyManager.PercentToRisk = 0.002;moneyManager.DataStore = Strategy.Run(typeof(SmaCrossover), vd, data);moneyManager.RunSimulation();Entries, exits, stops, targets
Section titled “Entries, exits, stops, targets”using Balsam;
class TestStrat : Strategy{ public int Threshold { get; set; } = 5;
public double EntryCoefficient { get; set; } = double.NaN;
public double StopCoefficient { get; set; } = 2;
public double TargetCoefficient { get; set; } = double.NaN;
public int Horizon { get; set; } = 5;
protected override void OnStrategyStart() { Col1 = Sma(Close, 200); Col2 = Rsi(Close, 2); Col3 = Atr(10); }
protected override void OnBarClose() { if (Close.Last > Col1.Last && CrossBelow(Col2, Threshold).Last) { if (double.IsNaN(EntryCoefficient)) { BuyClose(); //enter MOC //Buy(); //enter on the next bar's opening price } else { //attempt to enter on a limit at a slightly better price BuyLimit(Close.Last - Col3.Last * EntryCoefficient); } }
ExitOnStop(); ExitAtTarget("Atr target"); //override the default signal name 'Target'
if (MarketPosition == PositionSide.Long && CurrentPosition.BarsSinceEntry >= Horizon) { ExitOnClose("Horizon"); }
//ExitOnHorizon(Horizon); //equivalent to the above }
protected override void OnPositionOpening(Position position) { position.Stop = position.Entries.AvgGrossPrice - Col3.Last * StopCoefficient; SetStop(position, Col3.Last * StopCoefficient); //equivalent to above SetTarget(position, Col3.Last * TargetCoefficient); }}Optimization
Section titled “Optimization”Below we run a multi-threaded optimization across a portfolio of three equity indices, optimizing the exit parameters from TestStrat above. Note the [Optimize] attributes placed above the property names. Stopcoefficient is tested from 0.5 to 2.5 ATR’s in 0.5 ATR increments. TargetCoefficient is tested from 0.5 to 2 ATR’s in 0.25 ATR increments and also includes a NaN value which disables the target, causing the system to exit on either the stop or horizon. Finally Horizon, or the number of bars a trade is held, is tested with values of 1, 2, 3, 5 and 10. This results in 200 possible parameter combinations. Transaction costs of $2/contract and a half tick of slippage are passed in to the optimization via a VariableDictionary.
using Balsam;using Balsam.DataServers;using Balsam.MoneyManagement;using Balsam.Optimization;
 class TestStrat : Strategy {     public static void Run()     {         var server = new CsiBarServer(@"c:\data\csi\current");         var data = server.LoadSymbols("ES", "NQ", "ER");
         VariableDictionary vd = new VariableDictionary();         vd["TransactionCosts"] = new TickTransactionCosts { Commission = 2, Ticks = 0.5 };
         var opt = new Optimizer();         opt.Optimize(typeof(TestStrat), vd, typeof(FixedFractional), null, data);     }
     public int Threshold { get; set; } = 5;
     public double EntryCoefficient { get; set; } = double.NaN;
     [Optimize(0.5, 2.5, 0.5)]     public double StopCoefficient { get; set; } = 2;
     [Optimize(0.5, 2, 0.25, includeNaN: true)]     public double TargetCoefficient { get; set; } = double.NaN;
     [Optimize(1, 2, 3, 5, 10)]     public int Horizon { get; set; } = 5;
     protected override void OnStrategyStart()     {         Col1 = Sma(Close, 200);         Col2 = Rsi(Close, 2);         Col3 = Atr(10);     }
     protected override void OnBarClose()     {         if (Close.Last > Col1.Last && CrossBelow(Col2, Threshold).Last)         {             if (double.IsNaN(EntryCoefficient))             {                 Buy();             }             else             {                 BuyLimit(Close.Last - Col3.Last * EntryCoefficient);             }         }
         ExitOnStop();         ExitAtTarget();         ExitOnHorizon(Horizon); //equivalent to the above     }
     protected override void OnPositionOpening(Position position)     {         SetStop(position, Col3.Last * StopCoefficient);         SetTarget(position, Col3.Last * TargetCoefficient);     } }
When you call Run() above, the optimization will start:
Optimization run 67 of 200 (33.5%)
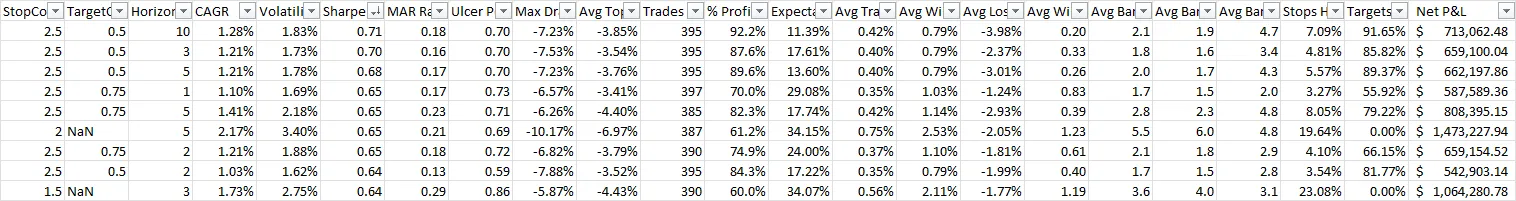
Elapsed Runtime: 0:00:12 Estimated Completion Time: 10:30:23 AM Estimated Time Remaining: 0:00:25________________________________________________________________________________________________________________________Best: Sharpe Ratio: 0.50 Trades: 392 {"StopCoefficient":1,"TargetCoefficient":1,"Horizon":2}Last: Sharpe Ratio: 0.47 Trades: 392 {"StopCoefficient":1,"TargetCoefficient":1.75,"Horizon":2}________________________________________________________________________________________________________________________10:29:44 Property to optimize: StopCoefficient: (0.5 to 2.5 by 0.5)10:29:44 Property to optimize: TargetCoefficient: (0.5 to 2 by 0.25) + NaN10:29:44 Property to optimize: Horizon: (1, 2, 3, 5, 10)10:29:44 Total iterations 200. 0 skipped due to binding constraints.10:29:44 Monitoring keyboard: <Esc> Cancel <E> Export to Excel <S> Save to file <P> Print compute pool statusWhen complete, the optimization report will be automatically exported to Excel. The image below shows the top ten parameter combinations sorted by Sharpe Ratio.