• 1 min read
Last Hour Surge
Event Studies
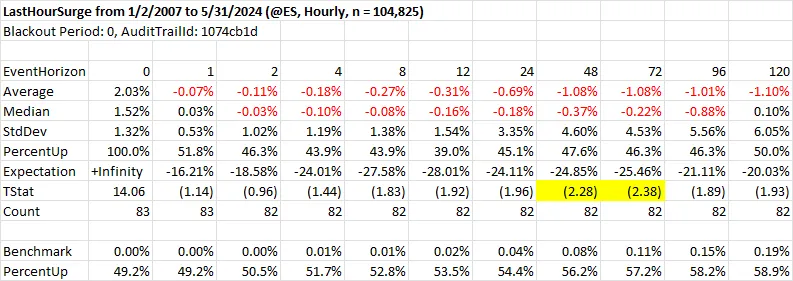
Friday’s last hour surge was fairly dramatic with the S&P futures rallying over one percent in the final hour of cash trading. Using hourly S&P futures data back to 2007 this has happened 82 times prior and typically leads to a pullback over the next several days with two and three days out (48 and 72 hour event horizons) showing statistically significant underperformance.
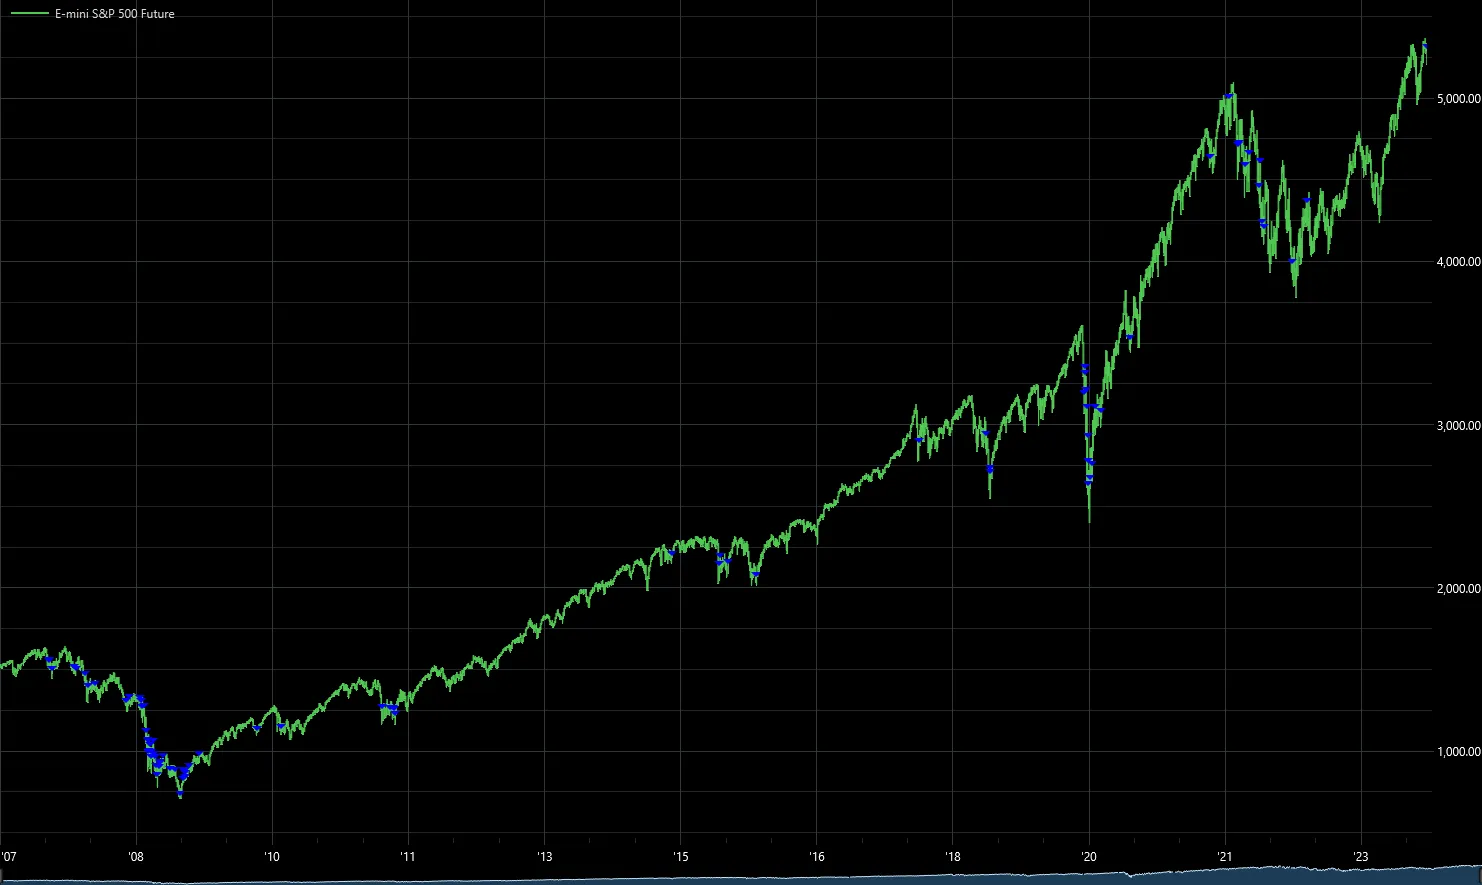
As you can see from the chart below, this type of panicky action is more often found in bear markets, with heavy representation during the financial crisis of 2007-08, the Covid crash, and Fed hiking cycle of 2022.
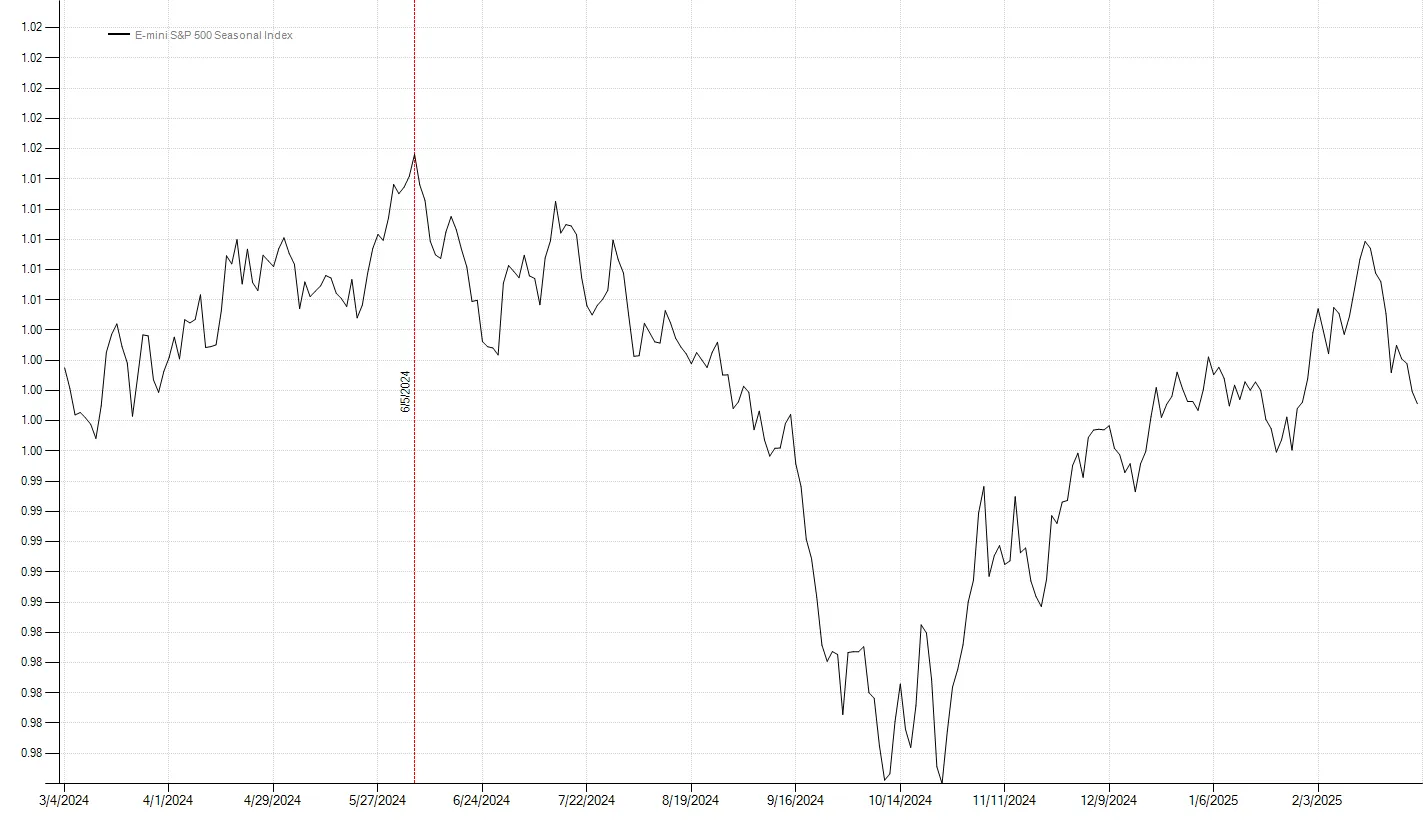
The upcoming week also marks a seasonal high in S&P futures. Perhaps ‘Sell in May’ is just delayed. Either way, it promises to be an interesting summer.
Code
class LastHourSurge : Strategy{    public static void Run()    {        var server = new AsciiBarServer(@"c:\data\temp");        var data = server.LoadSymbol("@ES").ToIntraday(60);
        var strat = new LastHourSurge();        strat.PrimarySeries = data;        strat.RunSimulation();        strat.EventStudyReport(0, 1, 2, 4, 8, 12, 24, 48, 72, 96, 120);        strat.Chart2();    }
    protected override void OnStrategyStart()    {        Col1 = PercentChange();    }
    protected override void OnBarClose()    {        if (CurrentDate.TimeOfDay == new TimeSpan(15, 0, 0) && Col1.Last >= 0.01)        {            SnapEvent();        }    }}