One For The Record Books
Bloomberg reported that Friday’s surge in META was the largest one day market cap gain in history at $197B. This is equivalent to the market cap of Linde PLC, a chemical conglomerate founded in 1879 and the 47th largest company in the S&P 500. Next up on the list is Cisco at #46 with a $204B market cap, which is apropos for the current environment.
Back in 1999-2000, Cisco was probably the bluest of the blue-chip technology stocks. It was viewed as a pure play on the growth of the internet. No matter what AOL, Netscape, or any other internet company might be doing, Cisco stood to benefit. The parallels to today’s narrative around Nvidia and AI are striking. I remember being out at a Midtown Manhattan steak house for a broker dinner (back when nickel commissions bought a lot of steaks) and John Chambers, the CEO of Cisco, came in with a small party. The whole restaurant turned to look. The buzz in the room was palpable as we were in the presence of dotcom royalty. It seems kind of quaint when today’s tech CEO’s travel like heads of state, but at that time, there were no bodyguards, only a few investment bankers.
Little did anyone know, Cisco was not far from a high that would remain untouched for over 21 years. The internet was indeed revolutionary and Cisco’s switches and networking gear were at its core and still are today. And yet, it turned out to be very difficult to profit from the incredible growth of the internet as an investor in public equity markets. I suspect the current AI mania will turn out much the same way.
The difficult thing about this of course is the timing. I’ve been thinking to myself the current leaders won’t make tops in the traditional sense. There are unlikely to be double tops or head and shoulders patterns or anything that might give you a clue that price isn’t confirming the narrative, much less allow for a clear stop-out point. At some point, buyers will exhaust themselves and things will turn. It’s likely there won’t even be an obvious catalyst except maybe in hindsight.
To confirm my suspicions, I pulled history from Tiingo, an excellent source for end-of-day historical data, for some of the big names from that era that are still around. This is just a sampling of names still trading under the original ticker and is by no means definitive. The table below shows the maximum drawdown on a total return basis. The average drawdown was a stunning 87.3% and these were among the survivors!
| Symbol | Start | End | Max DD | Years to recover |
|---|---|---|---|---|
| AAPL | 03/22/2000 | 04/17/2003 | -81.80% | 4.8 |
| AMAT | 04/07/2000 | 11/20/2008 | -85.22% | 17.1 |
| AMZN | 12/10/1999 | 09/28/2001 | -94.40% | 9.9 |
| CSCO | 03/27/2000 | 10/08/2002 | -89.26% | 21.4 |
| INTC | 08/31/2000 | 10/08/2002 | -82.25% | 17.5 |
| JDSU | 03/06/2000 | 11/20/2008 | -99.81% | Open |
| MSFT | 12/27/1999 | 03/09/2009 | -69.44% | 14.6 |
| MU | 07/14/2000 | 11/20/2008 | -98.25% | 21.5 |
| MXIM | 08/31/2000 | 11/20/2008 | -86.32% | 17.4 |
| NVDA | 01/03/2002 | 10/09/2002 | -89.72% | 4.9 |
| ORCL | 09/01/2000 | 06/03/2002 | -84.19% | 14.3 |
| QCOM | 01/03/2000 | 08/05/2002 | -86.75% | 14.2 |
The charts below show the six months leading into the top as well as three months after with the closing high marked by a downward arrow. Perusing these charts it’s hard to see what clues there might have been of an imminent top other than perhaps the massive vertical moves reminiscent of today.


Another specious record
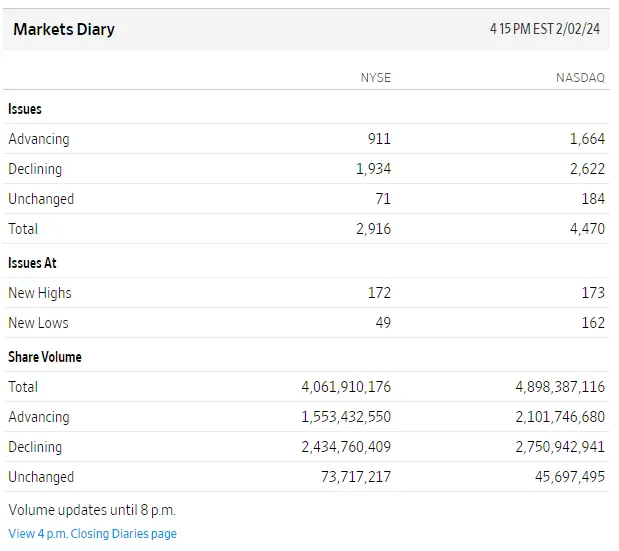
There was another incredible record made on Friday that will get much less coverage. The NYSE recorded its worst ever net advance-decline reading as a percent of issues traded coincident with an all-time closing high. And my data goes all the way back to 1932. You might object that the NYSE is less relevant in today’s market; after all, the Nasdaq is where the real action is. And yet incredibly, there were also more declining than advancing issues on the Nasdaq too.
Source: WSJ Markets Diary
Code
public static void Run(){    Tiingo server = new Tiingo("YOUR_API_KEY_HERE);
    var symbols = new string[] { "AMZN", "AAPL", "NVDA", "CSCO", "MSFT", "INTC", "QCOM", "AMAT", "MXIM", "ORCL", "MU", "JDSU" };
    foreach (var symbol in symbols)    {        var fileName = $@"c:\data\1999\{symbol}.csv";
        BarSeries data = null;        DrawdownCollection dd = null;
        if (File.Exists(fileName))        {            var contents = File.ReadAllText(fileName);            data = Tiingo.ParseResponse(contents, PriceAdjustment.Splits, symbol);            data.Tag = contents;        }        else        {            data = server.LoadSymbol(symbol);            File.WriteAllText(fileName, data.Tag.ToString());        }
        var tr = Tiingo.ParseResponse(data.Tag.ToString(), PriceAdjustment.TotalReturn, symbol);        dd = DrawdownCollection.Calculate(tr.Close);
        int n = 1;
        foreach (var d in dd.OrderBy(x => x.Percent).Take(n))        {            Console.WriteLine($"{symbol} {d} {(d.IsOpen ? "Open" : "")} {(d.FlatPeriodTime.TotalDays / 365.25):N1} ");            var subset = Tiingo.ParseResponse(data.Tag.ToString(), PriceAdjustment.Splits, d.StartDate.AddMonths(-6), d.StartDate.AddMonths(3), symbol);            var cht = new Chart2();            cht.Plot(new PlotInstruction { Series = subset });            cht.AddEventMarkers(new EventMarker[] { new EventMarker { Date = d.StartDate } });            cht.SaveImage($@"c:\data\1999\charts\{symbol}.png", System.Windows.Forms.DataVisualization.Charting.ChartImageFormat.Png);        }    }
    Console.ReadLine();}