Retracements
They say they don’t ring a bell at the top and that’s true in my experience. Only in hindsight is a narrative built to explain price action. But in real-time, what looks like a run-of-the-mill correction, can sometimes turn into the top.
In the chart below, we can see several “healthy corrections” in a roaring bull market. This phrase has popped up repeatedly in headlines and market commentary over the past week or two. It’s probably been around as long as markets have.
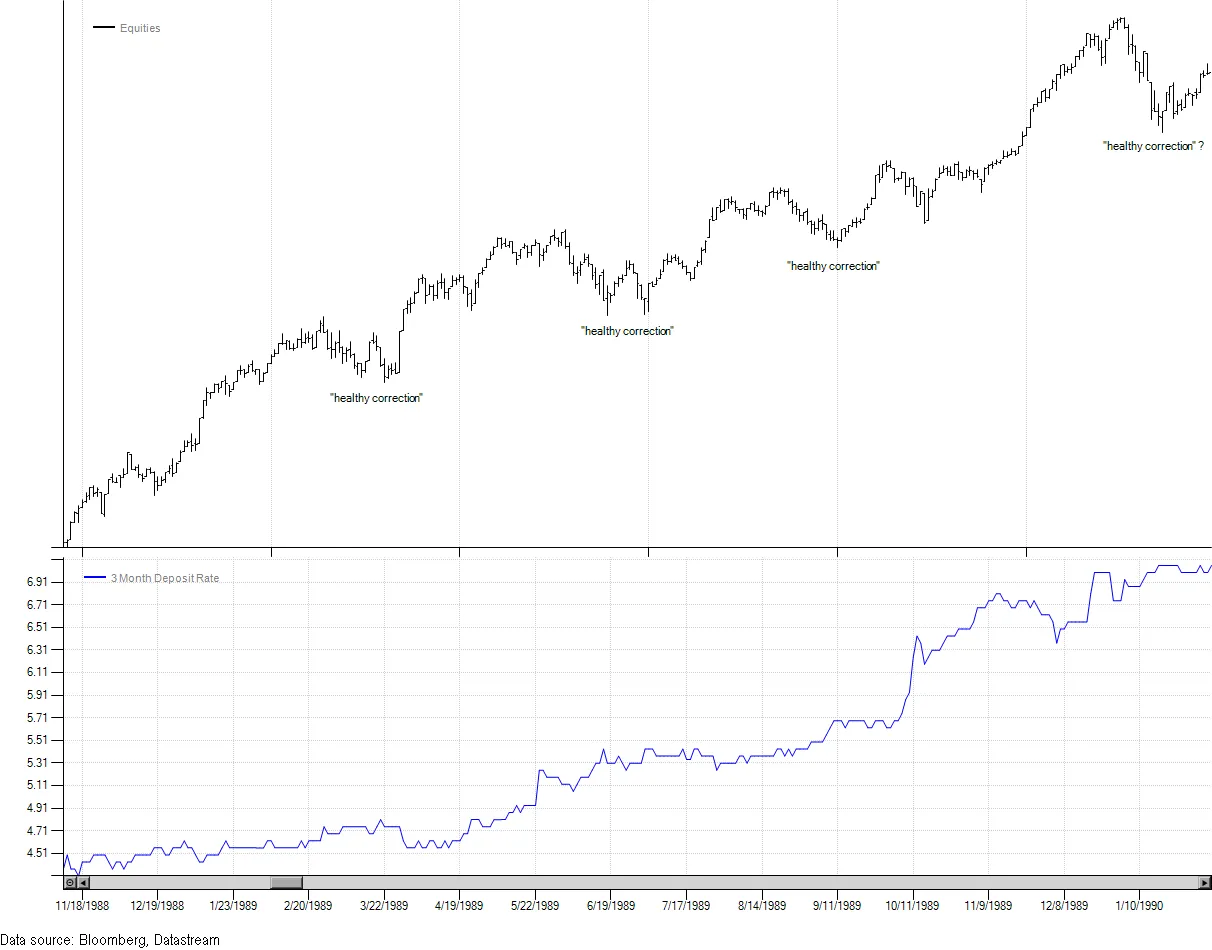
Even without the price scale and legend, students of market history may notice the dates on the x-axis and correctly surmise this is the Nikkei. The last correction off the high doesn’t look much different than any of the prior minor sell-offs. Interest rates had been rising all year and hadn’t previously been an impediment. But the high was in. Even the most ornery bear wouldn’t have predicted an 82% drawdown lasting over 34 years.
For those not familiar with how percentages work when it comes to investment returns, an 82% drawdown requires a 555% gain just to get back to even! So generally it’s something to be avoided if all possible. Now I am NOT saying or predicting we are about to enter a 34-year bear market. I have no idea; nobody does. So in that sense, buy and hold is a perfectly rational response and probably the correct strategy for most.
However, I do believe the range of possible outcomes is widely underestimated, and for those open to market timing, studying past bear markets might be informative. That is what motivated the study of the filter rule I originally wrote about in Missing The Top. I wasn’t setting out to design a timing system per se, but was more interested in optimal entries once the tide had turned.
To do that, I used eight total return series from 1973 through late 2021 (see the original post for details). With the benefit of hindsight, I identified drawdowns of 25% or greater in each series. I ended up with 57 instances with an average decline of 43.15% including dividends. In other words, these are serious bear markets that will be extremely unpleasant for the vast majority of investors.
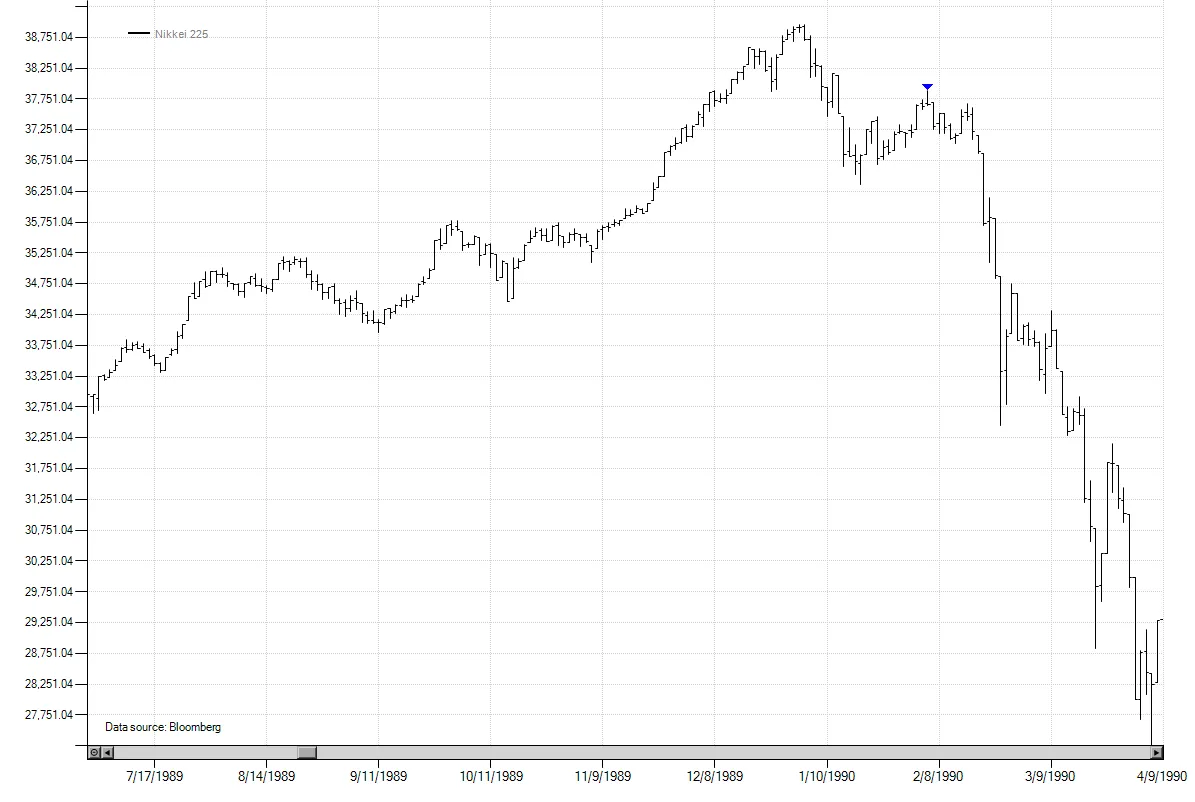
The question I wanted to answer was, if after an initial decline, what was the optimal entry point? Could we enter on a retracement, like the hypothetical sell arrow in the updated Nikkei chart below, and get a better entry price than a simple trend-following filter rule?
Again using the benefit of hindsight, after an initial decline threshold of x% was breached, I identified the first counter-trend rally of at least 1% that failed and ultimately went on to make new lows. As in the original study, I tested initial decline thresholds from 3% to 20%. And since we are using hindsight, I also assumed super-powers that allowed us to sell the exact closing high of the retracement.
In the table below, the percentages listed in the first three columns are relative to the closing high of the preceding bull market. Let’s take the -8% initial threshold as an example since this was the optimal sell threshold from the filter study. We will sell as soon as the market closes 8% or more off the previous all-time high. Using that logic, our average entry price ends up being -9.25%. That’s because the market doesn’t kindly wait for us to sell at good prices. In a real bear market, things can turn ugly quickly and we incur 125 basis points of slippage from our theoretical entry price right off the bat. But being the savvy professional, we aren’t going to panic and will wait for a retracement to sell. With the benefit of hindsight, we can sell the exact closing high of the first bounce, and yet we end up with a slightly worse average entry price of -9.28%! Also note the average trough in the penultimate column. This is the average closing low relative the prior bull market high before the initial retracement commenced. Not only did we achieve a roughly equivalent entry price to the trend entry, we also had to take a lot more “heat”, sitting through a -12.93% drawdown before the rally of 1% or more.
That leads to a few key takeaways from this study:
-
For relatively small thresholds below 10%, your best bet is to just get the trade on. It will feel like you are selling the low (and you might be), but if you truly think we’ve entered a bear market, the gains from finessing the exit are limited considering the potential downside.
-
As the initial decline gets more extreme, the potential to exit long positions (or enter shorts) at better prices increases. With patience (and luck) you should be able to capture some of the potential price improvement even without perfect foresight.
-
Traders often talk about, and trade around, retracement levels, defined as a price change expressed as a percentage of the prior leg on the opposite side. 50% is most commonly used as are more esoteric Fibonacci numbers like 38.2% and 62.8%. The last column shows the average retracement versus the initial decline. In a big bear market, except for the most shallow initial declines, you are unlikely to see a 50% retracement on a closing basis. The longer the market goes without having a 50% retracement may in fact be a clue that you are in a bear market.
-
If you are going to panic and sell, better to panic early. As the decline gets deeper, the inevitable retracement bounces will typically become stronger and more convincing. The only thing worse than buy and hold in a major bear market is to panic out at a low only to buy back higher and then have the market make new lows. If you are truly a buy and hold investor, make sure your portfolio risk is appropriate. If you outperformed materially on the way up, it may mean your portfolio is riskier than you think, not that you are the next Warren Buffet.
-
While it may be a helpful guide, these are only broad, aggregate tendencies. Averaging very different types of bear markets may obsfucate the optimal exit strategy. For example, waiting patiently for a retracement when there has been an serious exogenous shock like COVID is probably not the right strategy, whereas concerns of a slowing economy or rising interest rates tend to unfold over a longer time frame with the concomitant opportunities for retracements.
| Initial Decline Threshold | Avg Entry Price | Avg Retracement Entry Price | Avg Improvement | Avg Trough | Avg % Retracement |
|---|---|---|---|---|---|
| -3.00% | -3.76% | -5.20% | -1.44% | -8.01% | 41.38% |
| -4.00% | -4.97% | -5.72% | -0.75% | -8.83% | 39.69% |
| -5.00% | -6.10% | -6.32% | -0.21% | -9.49% | 36.54% |
| -6.00% | -6.89% | -6.85% | 0.04% | -10.32% | 37.24% |
| -7.00% | -8.19% | -8.17% | 0.02% | -11.75% | 33.73% |
| -8.00% | -9.25% | -9.28% | -0.04% | -12.93% | 30.64% |
| -9.00% | -10.17% | -9.72% | 0.46% | -13.67% | 31.21% |
| -10.00% | -11.33% | -10.49% | 0.84% | -15.01% | 31.02% |
| -11.00% | -12.30% | -11.12% | 1.17% | -15.89% | 31.03% |
| -12.00% | -13.60% | -11.91% | 1.69% | -16.88% | 30.85% |
| -13.00% | -15.03% | -13.40% | 1.63% | -18.07% | 27.08% |
| -14.00% | -16.07% | -13.73% | 2.34% | -18.92% | 29.50% |
| -15.00% | -17.01% | -14.76% | 2.26% | -19.43% | 25.40% |
| -16.00% | -18.17% | -15.48% | 2.69% | -20.64% | 26.18% |
| -17.00% | -19.46% | -16.29% | 3.18% | -21.22% | 24.23% |
| -18.00% | -20.34% | -17.24% | 3.10% | -22.24% | 23.22% |
| -19.00% | -20.95% | -17.71% | 3.24% | -22.71% | 22.68% |
| -20.00% | -22.24% | -18.59% | 3.66% | -23.97% | 23.23% |
Note: This study was originally posted on 7/27/20204 and revised on 8/4/2024. The original post used the maximum retracement observed after the initial decline rather than the first retracement. While interesting in its own right, the maximum retracement isn’t as relevant as the first retracement from a tactical perspective since we were trying to identify the optimal implementation of a trend exit. The original conclusions remain unchanged.