Russell Rotation
I have run countless event studies over the past several weeks quantifying breadth divergences from different angles. I have refrained from commenting recently as the conclusions would come as no surprise nor would they add any insight that hasn’t already been shared ad-nauseum on Twitter. So after seven consecutive up days on lackluster to abysmal market breadth, today’s sell-off in mega-cap technology isn’t surprising. What is surprising, however, was the aggressive rotation into small caps despite the sell off. I would have thought the inevitable shakeout in market leadership would have shifted sentiment, at least temporarily, taking down everything with it. I couldn’t have been more wrong.
The Russell 2000, which had been the clear laggard, staged a massive rally and went out at the highs, outperforming the S&P by 4.45%. Going all the way back to the start of Russell 2000 history in 1979, a greater one-day performance spread has only been observed three times prior: 1987, 2008 and 2020. All of these were around major market lows; it has never happened with the market trading near all-time highs.
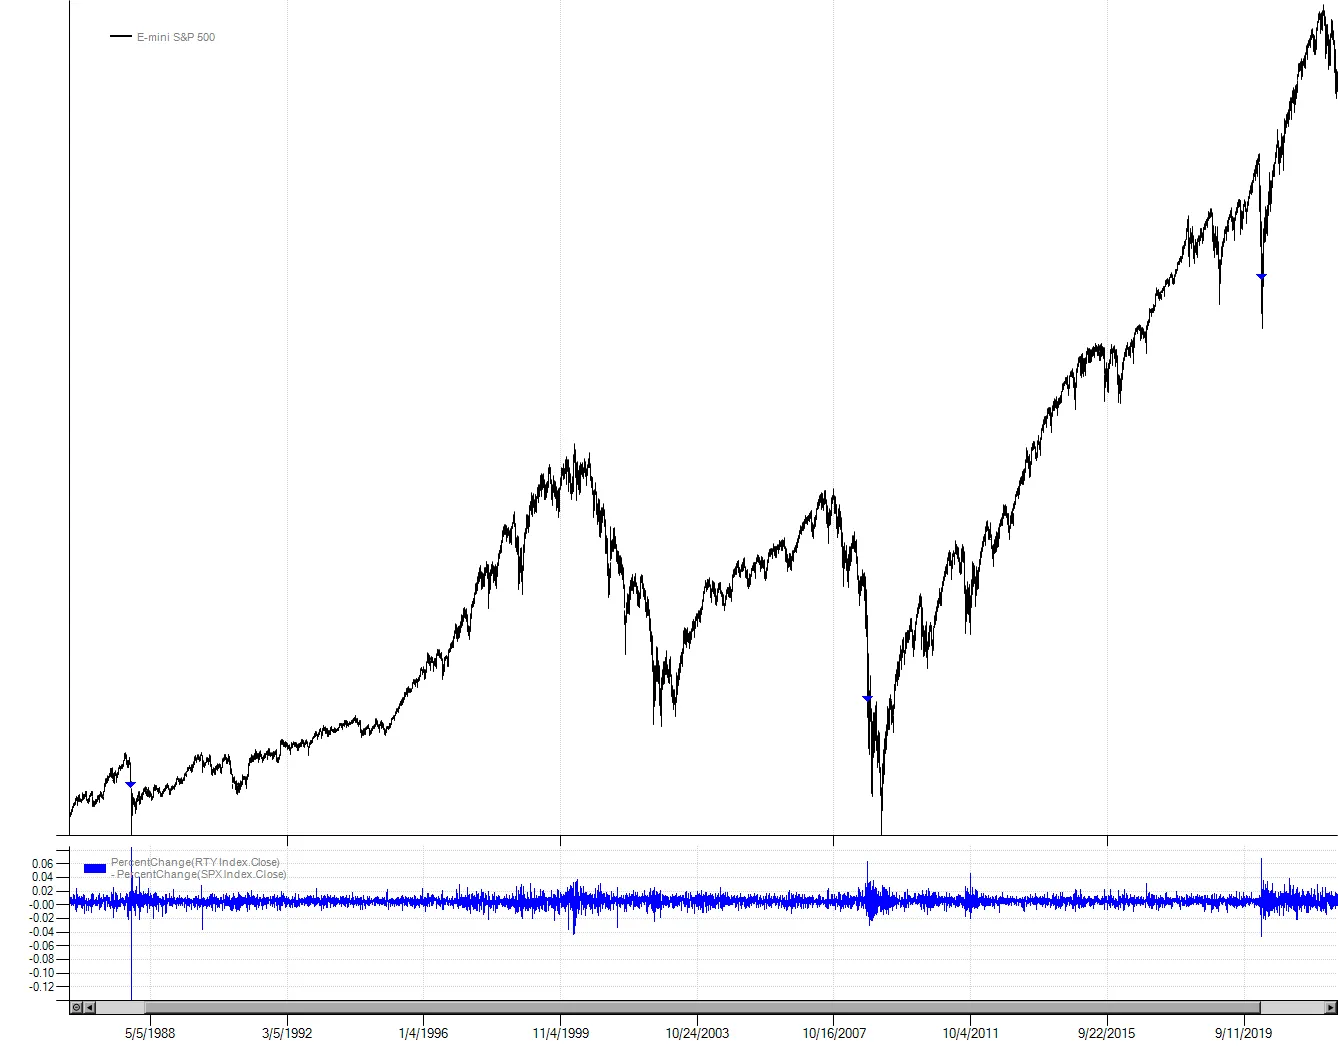
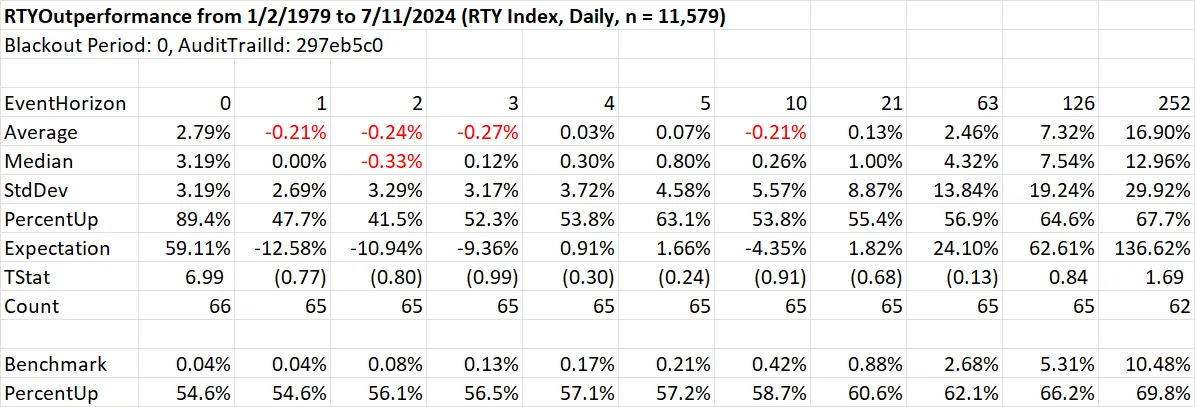
The $64,000 question of course is whether this one-day wonder has any forward predictive value. Is this the start of the fabled broadening out that will lead the next leg of the bull market or is it a trap? Since there were only three prior observations greater than today’s spread, I lowered the outperformance threshold to 2%, which is still in the 99th percentile of all daily observations. If we look at the performance of the Russell 2000 cash index after it has outperformed the S&P by 2%, we find 65 observations prior to today. The Russell gains have a slight tendency to revert one to three days out. If you also require that the Russell was up like it was today (not just losing less than the S&P, which is admittedly rare) results improve somewhat but are still marginal (not shown).
While significant one-day outperformance may not lead to absolute gains over the short-term, does it signify anything for relative gains? To look at this we run the same event study but on the ratio of the Russell 2000 to the cash S&P 500.
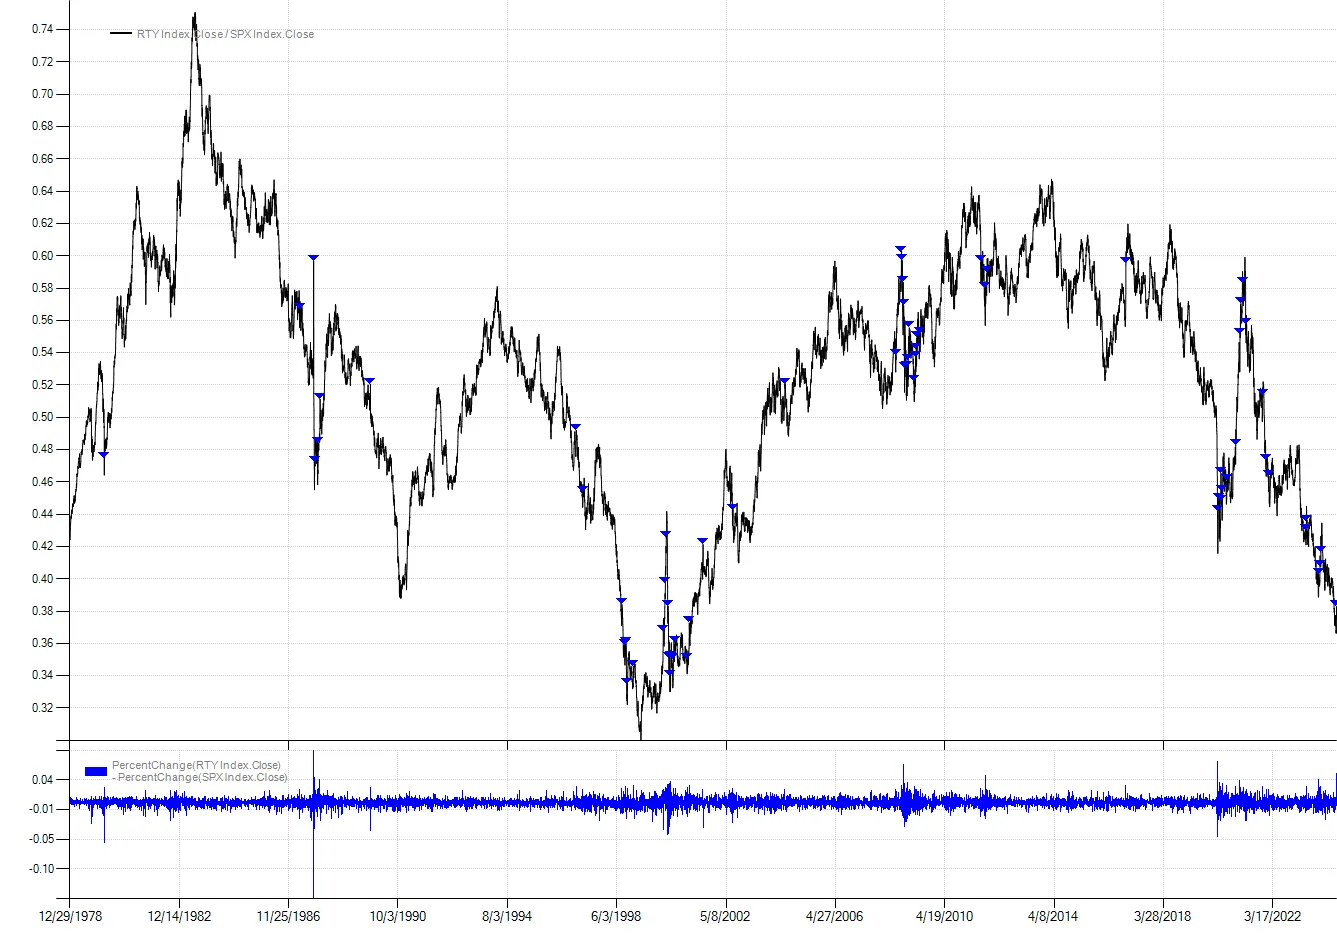
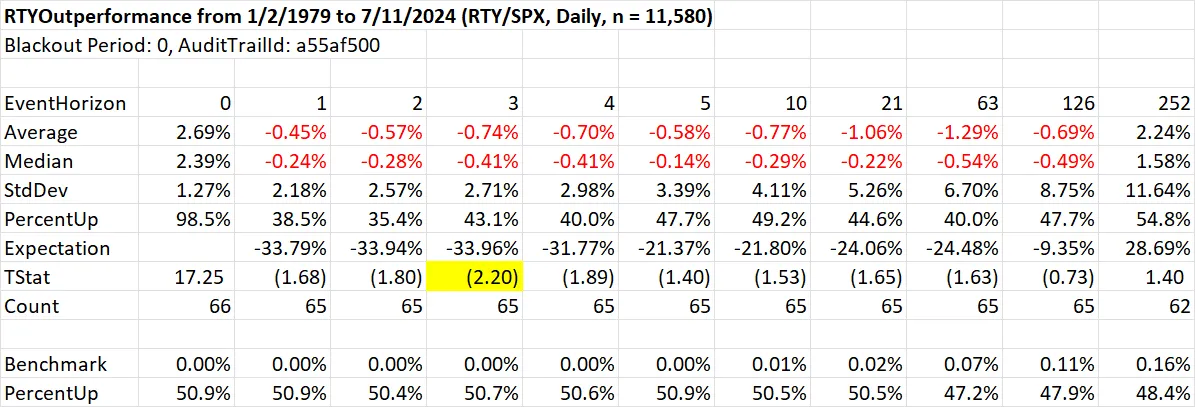
Unfortunately, the data does not support the broadening out hypothesis. The RTY/SPX ratio has tended to consistently underperform the benchmark after these one-day wonders.
Of course anything can happen. This market is as wild as anything I’ve seen in thirty plus years of watching equities. From a purely tactical perspective, the next several days are likely critical for small caps. If they can’t hold onto and build upon today’s gains, the odds increase for it being perhaps one of the more seductive bull traps in recent memory. I will say it does feel like everybody wants to believe. And that may just be enough to pull another rabbit out of the hat.
class RTYOutperformance : Strategy{  public static void Run()  {    var strat = new RTYOutperformance();    strat.RunSimulation();    strat.EventStudyReport();    strat.Chart();  }
  protected override void OnStrategyStart()  {    AsciiBarServer server = new AsciiBarServer(@"c:\data\orchestrator", AsciiBarServer.DOHLC);    var rty = server.LoadSymbol("RTY Index");    var spx = server.LoadSymbol("SPX Index", rty.FirstDate);
    //PrimarySeries = rty;    PrimarySeries = (rty.Close / spx.Close).ToBarSeries();    Col1 = rty.PercentChange() - spx.PercentChange();
    Plot(Col1, 1, Color.Blue, "Column");  }
  protected override void OnBarClose()  {    if (CrossAbove(Col1, 0.02).Last)    {      SnapEvent();    }  }}