Volatility of Volatility
Today I saw a post referencing the fact that the CBOE VVIX had recently fallen to its lowest level since May 2015. For those that aren’t familiar with the VVIX, it is the expected volatility of the VIX 30 days forward, or in other words, a derivative of a derivative of a derivative! Mind-bending recursion aside, I thought it was worth a quick investigation to see if extreme lows in the VVIX have any relevance for forward S&P returns.
The chart below shows the CBOE VVIX index plotted with the S&P. The dotted blue lines over the VVIX denote 63-day pivot lows that are at least a half a standard deviation below the mean shown by the red line. Now of course you only know a pivot low in hindsight after 63 bars from the pivot low have elapsed. Obviously this can’t be used for trading, but it is an easy and objective way to select significant lows for analysis.
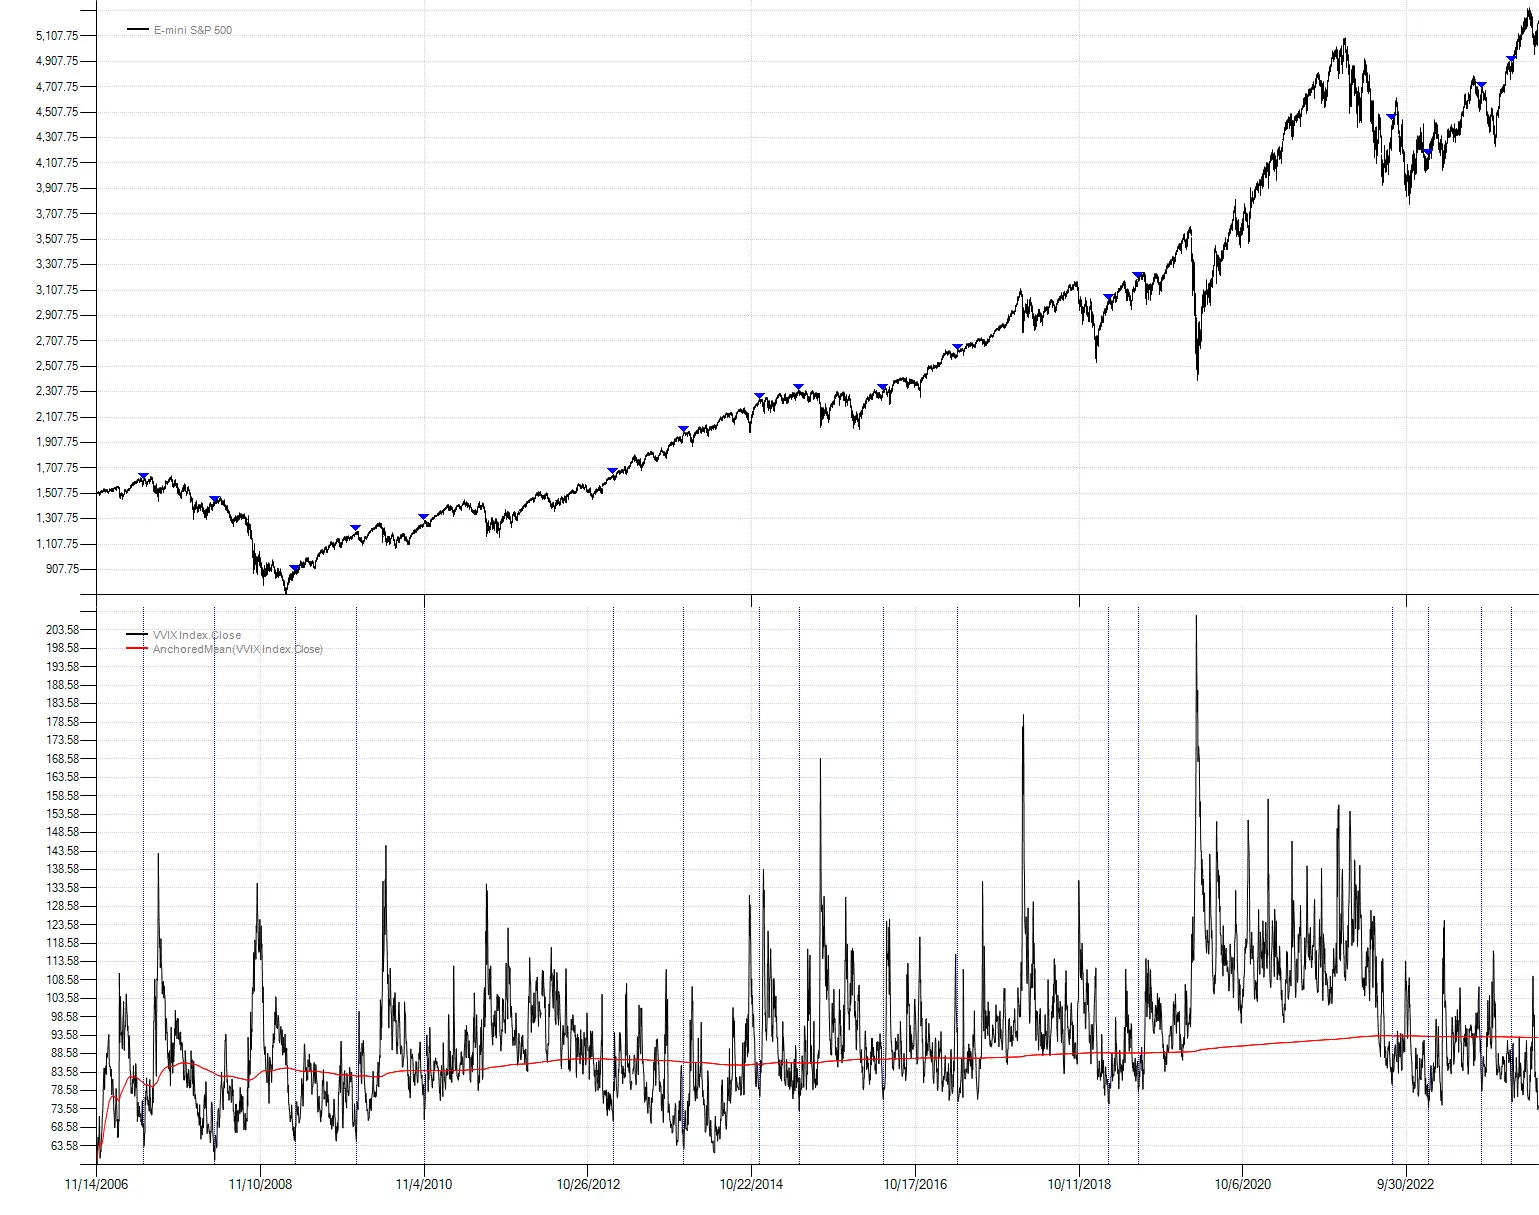
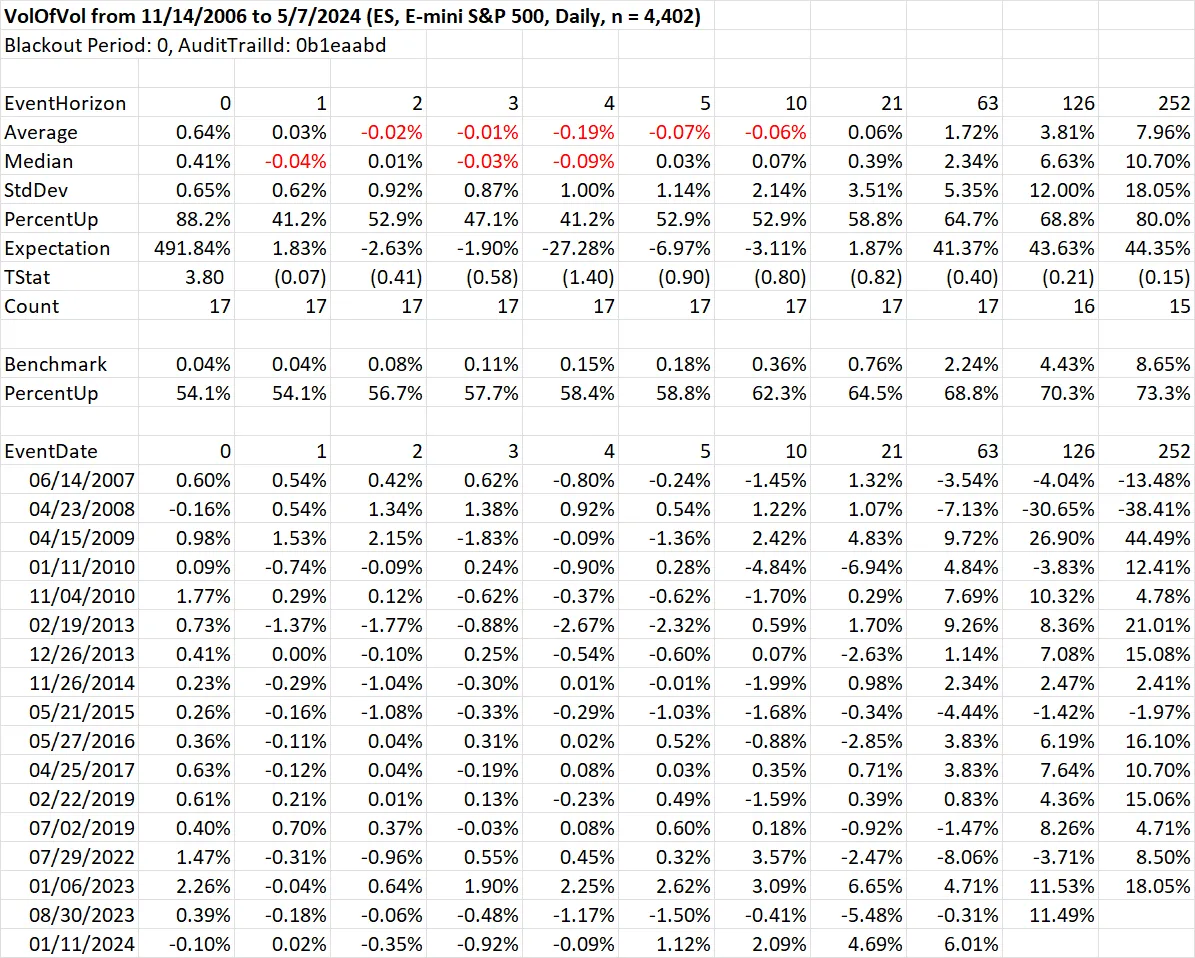
After a VVIX pivot low, S&P futures tend to show modest weakness versus the benchmark across all timeframes and minor absolute losses over the short-term peaking at four days out. Even if we could somehow peek three months into the future and know a VVIX pivot low had been formed, this is not particularly useful.
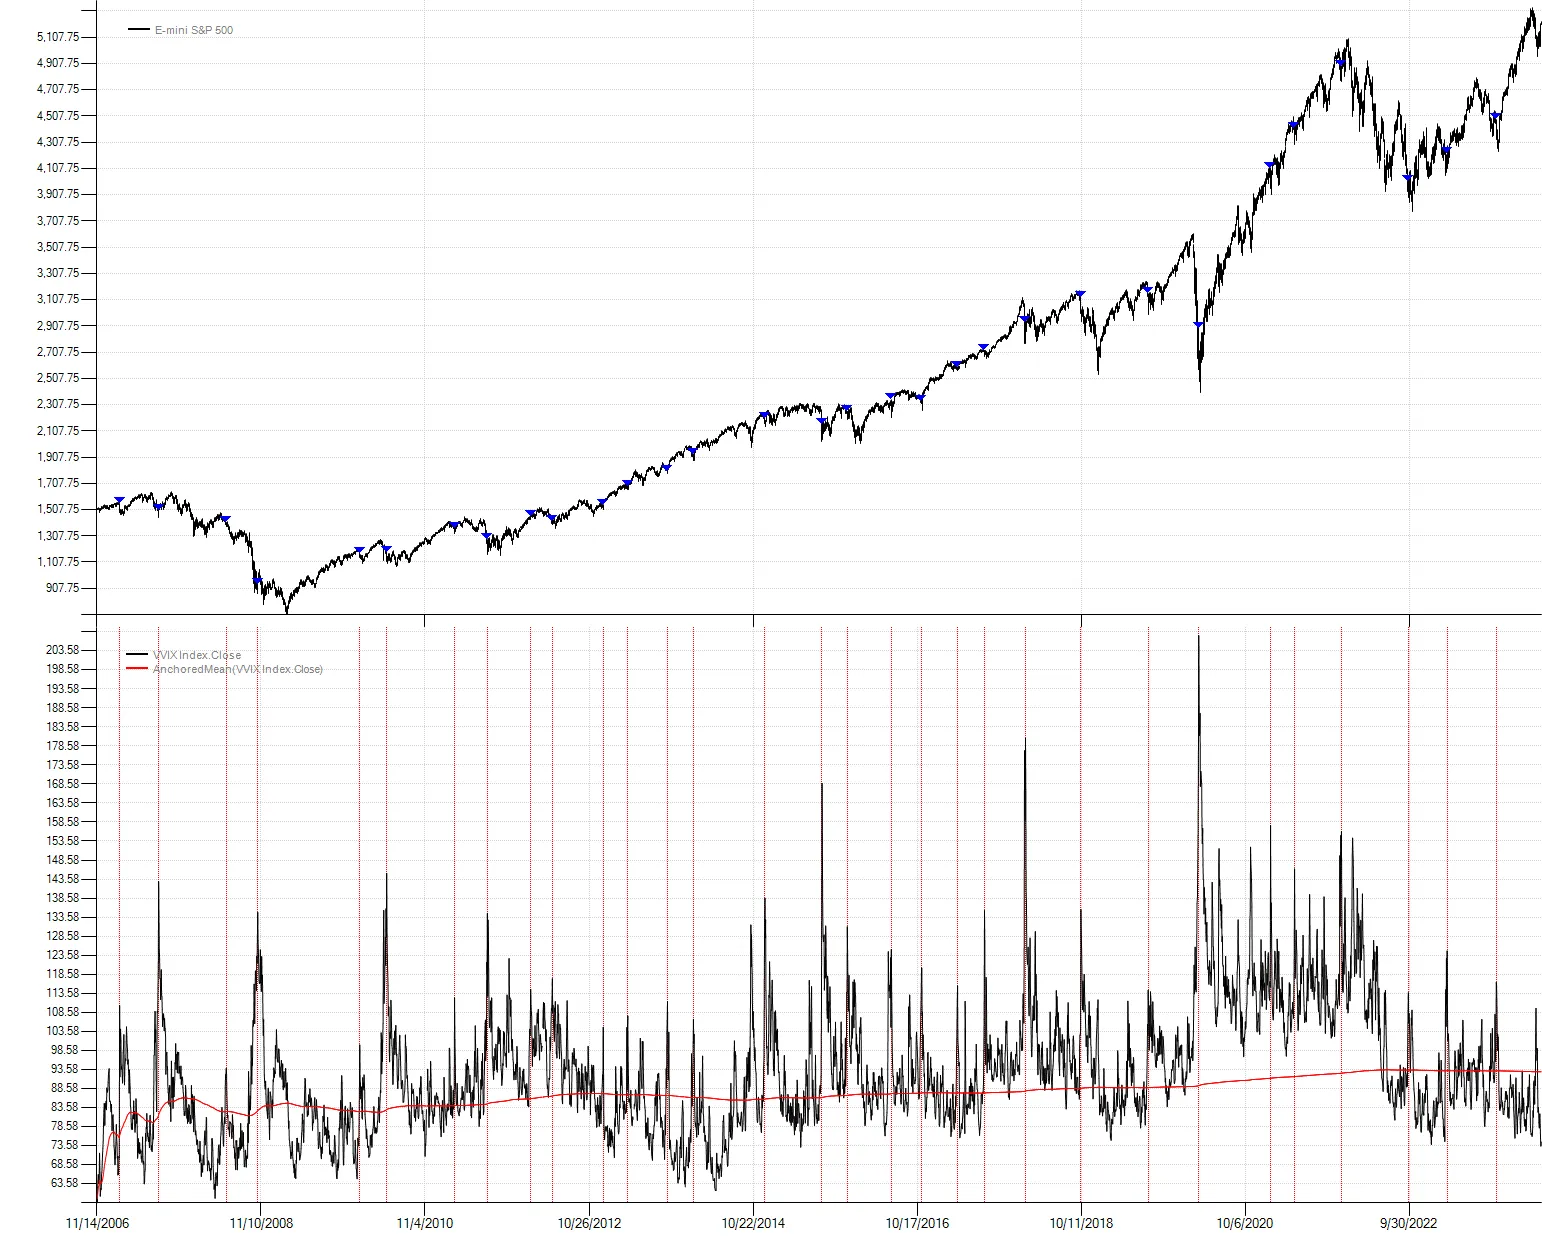
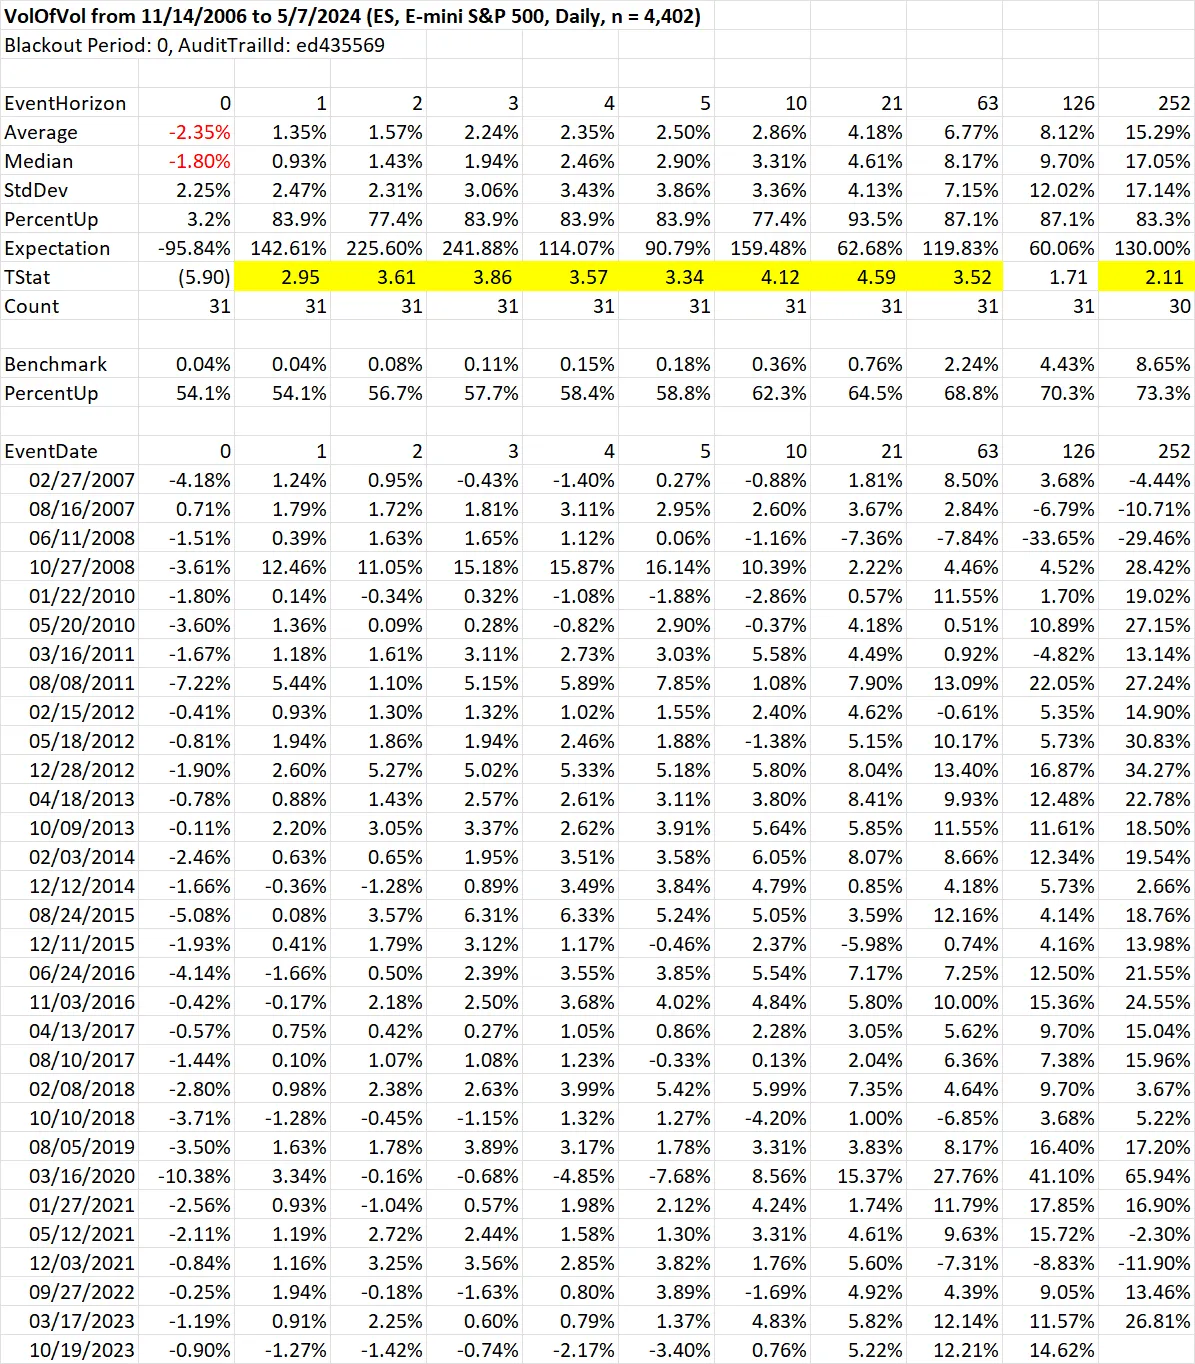
However, if we flip the logic and look at 63-day pivot highs, the results become far more interesting. When the VVIX turns down from very high levels, returns are very strong across all timeframes. This gives us a clue where to focus on building rules that might be useful for actual trading: pay attention to the highs and ignore the lows. The VVIX is updated intraday every 15 seconds so presumably you might be able to quantify a turn with relatively minimal lag compared to our toy example. I’ll leave this as an exercise for the reader. Let me know what you find!
Code
class VolOfVol : Strategy{    public static void Run()    {        CsiBarServer server = new CsiBarServer(@"c:\data\csi\current");        var data = server.LoadSymbol("ES", new DateTime(2006, 11, 14));
        var strat = new VolOfVol() { HighVol = true };        strat.PrimarySeries = data;        strat.RunSimulation();        strat.EventStudyReport();        strat.Chart();    }
    public int Length { get; set; } = 63;
    public bool HighVol { get; set; }
    private List<DateTime> _dates;
    protected override void OnStrategyStart()    {        base.OnStrategyStart();
        var vvix = BarSeries.Load(@"c:\data\temp\VVIX Index.csv").Subset(new DateTime(2006, 11, 14));        Col1 = vvix.Close;
        TimeSeries pivot;
        if (HighVol)        {            pivot = Indicators.PivotHighBar(Col1, Length);        }        else        {            pivot = Indicators.PivotLowBar(Col1, Length);        }
        var z = Indicators.ZScore(Col1);
        Plot(Col1, 1, Color.Black, paneSize: 50f);        Plot(Indicators.Mean(Col1), 1, Color.Red);
        _dates = new List<DateTime>();
        for (int x = pivot.MaxBarsBack; x < pivot.Count; x++)        {            if (pivot[x] == Length && ((HighVol && z[x - Length] >= 0.5) || (!HighVol && z[x - Length] <= -0.5)))            {                var dt = pivot.Dates[x - Length];                _dates.Add(dt);                Plot(new PlotInstruction { XValue = dt, Pane = 1, Color = HighVol ? Color.Red : Color.Blue, LineStyle = "Dot" });            }        }    }
    protected override void OnBarClose()    {        base.OnBarClose();
        if (_dates.Contains(CurrentDate))        {            SnapEvent();        }    }}