Breadth Divergence
The complacency in US equities was finally shaken last week with a fairly substantial selloff, concentrated primarily in the AI/tech names that led the prior rally. Students of market history won’t be particularly surprised that names like Super Micro are already off 40% from the highs in a little over a month (see One For The Record Books for prior examples). What caught my eye however was the very strong NYSE breadth on Friday. There were over 1,000 net advancing issues despite the S&P closing down -0.88%.
Source: WSJ Markets Diary
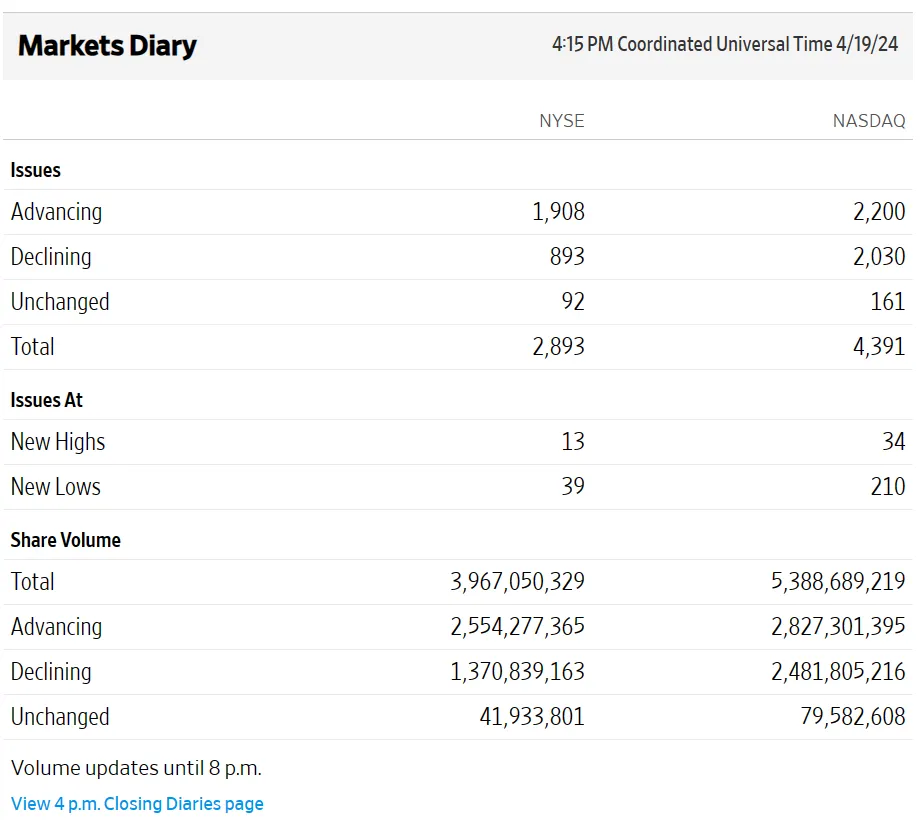
Now it’s possible this was related to options expiry on Friday but it could also be a sign of underlying strength. I wanted to quantify “normal” breadth for a given move in the S&P and see if anything can be gleaned from “abnormal” breadth like we saw on Friday. Using daily NYSE breadth data back to 1950, I first calculated net breadth as a percent of issues traded to account for the varying levels of issuance through time. So for Friday, the % breadth reading was 0.35 (1908 advances - 893 declines) / 2893 issues traded. I then regressed the net breadth reading versus the S&P 500 cash returns ignoring any extreme S&P moves beyond +/- 2%. (As you are undoubtedly aware, the distribution of S&P returns is extremely fat tailed and the relationship between returns and breadth becomes non-linear at the extremes.)
If we plot S&P returns versus breadth we find the following scatter chart:

Within this range of +/- 2% daily S&P returns the relationship is fairly well behaved and looks like one might expect. Positive returns are correlated with positive breadth readings. I fitted a regression line as well as +/- 3 standard deviations bands based on the residuals of the regression. Friday’s 0.35 breadth reading, highlighted by the green marker, is a true outlier at 4.5 standard deviations. In fact, it’s the most extreme outlier in the whole dataset covering 74 years and almost 18,000 observations.
Do these breadth outliers have any predictive utility for future S&P returns? If we look at standardized residuals greater than or equal to three standard deviations (essentially all the dots above the upper blue band in the scatter chart) we find the market typically rallies over the next several days peaking at four days out. So Friday’s abnormally strong breadth may in fact be a sign of underlying strength.

 After Friday’s decline, the S&P closed -5.46% off its all-time closing high on March 28th. A five percent decline in and of itself is not particularly notable, but coming off an all-time high it does tend to lead to a bounce. Using S&P cash data since 1928, initial declines of five percent or more from an all-time closing high have historically lead to statistically significant positive returns five days out.


Despite these studies suggesting the possibility of an upside edge, there are a lot of strange cross-currents and macro risks at the current juncture so it pays to be circumspect about the limits of historical analyses such as these, even more so than usual. Anything can happen, so be careful out there!
Code
class InitialFive : Strategy{    public static void Run()    {        AsciiBarServer server = new AsciiBarServer(@"c:\data\orchestrator", AsciiBarServer.DOHLC);        var data = server.LoadSymbol("SPX Index");
        var strat = new InitialFive();        strat.PrimarySeries = data.Close.ToBarSeries();        strat.RunSimulation();        strat.EventStudyReport();        strat.Chart();    }
    private bool _canEnter = true;
    protected override void OnStrategyStart()    {        base.OnStrategyStart();
        Col1 = Indicators.Highest(Close);        Col2 = Close / Col1 - 1;        Condition2 = CrossBelow(Col2, -0.05);
        Plot(Col1, 0, Color.HotPink);    }
    protected override void OnBarClose()    {        base.OnBarClose();
        if (_canEnter && Condition2.Last)        {            SnapEvent();            _canEnter = false;        }
        if (Close.Last == Col1.Last)        {            _canEnter = true;        }    }}